
The way reports are run in Spire is fundamentally different from how they are run in BusinessVision and most other accounting software. Although it may seem frustrating at first, the Spire method is quite powerful and more efficient as well.
In BV, all reports are located in the Reports module, from where you select the module and the report. Once you select the report, you choose parameters, such as the date, the sales rep, and the currency. You select the report and parameters first, and the system gets the data. This process is reversed in Spire for most reports, where you select the data first, and then the report.
In Spire, all reports are located where the related data is located. For example, all sales history reports are located in the sales history module.
The big difference is that you FIRST use Spire’s powerful filtering feature to select the data on which you would like to report, and THEN you click on the Print icon. The key to printing happiness is effectively and efficiently filtering your data first.
Once you click on the Print icon, you can select many reports all at once. For example, in Sales History, if you filter on sales with an invoice date of ‘Today’ and click on the Print icon, you can run both Customer Sales History and Inventory Sales History at the same time.
The other important bit is that you can report on all the information on your screen, or just selected items. You select rows of information by making them blue, which you can do by hitting Ctrl+Click to select/deselect individual items or Shift+Click to select a range of items. The print icon has a little down arrow beside it from where you can choose Print All or Print Selected.
![]()
The default is “Print Selected”, so if you were to click on the print icon without clicking on the down arrow, you would get a report based on selected information.
The final important difference is that you can email any report right from the reports screen.
Certain modules have a report icon on the main screen as well as a reports tab, such as Accounts Receivable and Accounts Payable. These will be covered separately.
Here is an example of a standard report in Sales History:
This example presumes that you already know how to filter your data. Please see Filters in the Spire User Manual for written material on this, or if you prefer a video, please see the Filters, Searches and Exports video.
Go to Sales History and either use an existing filter or create a new one.

Click on the Print icon
You are presented with all reports available from that screen:
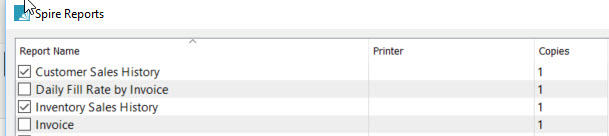
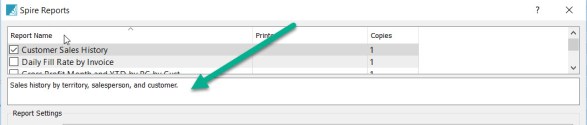
Note that below the report list there is an area which briefly describes what the report does:
When you hit Preview at the bottom of the window, you will get both reports, each one on a separate tab.
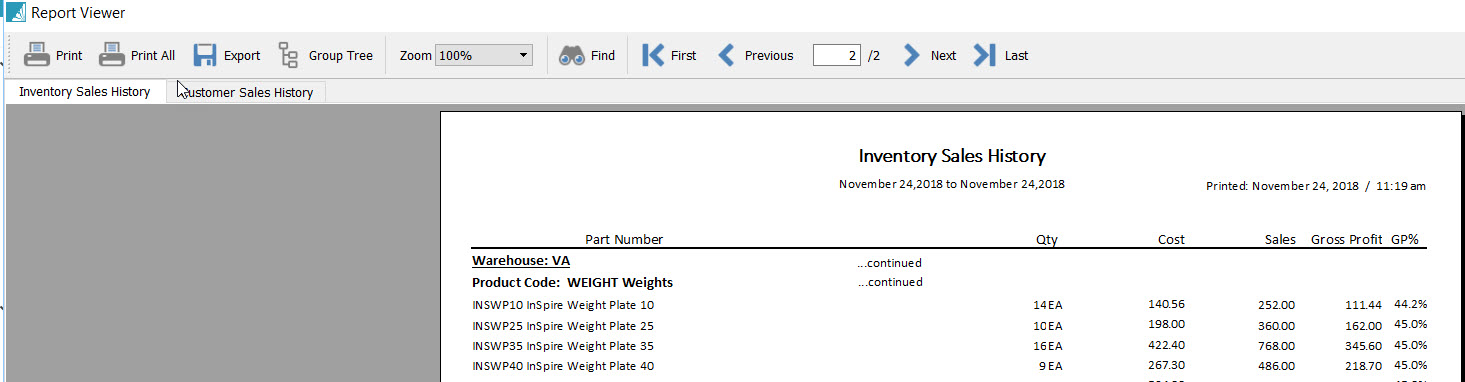
If you had highlighted only certain of the rows and hit “Print Selected”, the report will only have returned data for those rows.
Report Settings
On the Print window at the bottom, you can specify the Report Settings.
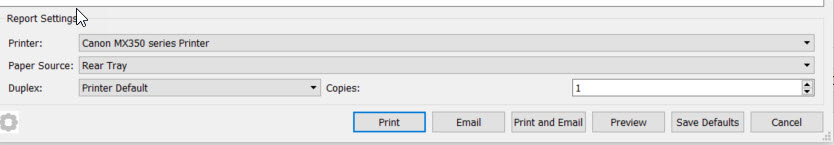
If you always just print the report to your default printer, you do not need to make any changes. However, you can specify a different printer, increase the number of copies or change the tray. If you always print the report in a specific way, with the report highlighted above, click on ‘Save Defaults’ and the next time you print that report, those settings will be used.
Emailing the report
If you would like to email the report to someone right away, you can click on Email, and an email dialogue will open that will allow you to send the form or report right away, assuming your email is configured already.
Printing Reports from the Reports Tab – A/R, A/P, G/L and Inventory.
A/R and A/P:
When you print reports from the Print icon, the data is based on the current date. If there are post-dated payments or invoices, the report will not agree to the GL. If you need to agree it to the GL, use the Reports Tab.
In order to print a report for the prior month end, for example, you need to need to be on the Reports Tab.

Once on the reports tab, on the left side, you can select either the Accounts Receivable List or the Accounts Receivable Ledger.
Accounts Receivable List:
Set the ‘Select Aging Date’ to the month desired. If you do not click on the ‘Show Details’ box, you will see the SUMMARY ‘Aged Accounts Receivable List’. If you click on ‘Show Details’, you will get the DETAILED ‘Aged Accounts Receivable Report’, which includes contact details and details for each invoice.
If you click Show Details for Customer Statements, you will see payment applications for partially paid invoices.
The Historical Accounts Receivable List ignores backdated transactions posted after the selected date.

Accounts Receivable Ledger:

Here you can select a range of transaction dates. The Customer Payments List provides payment posted; selecting Details adds the invoices paid by each payment.
The Customer Transaction Activity shows the series of invoices and payment; selecting Details shows to which invoices payments were applied.
For those used to BusinessVision, you will appreciate that you can limit the beginning and ending dates of this report!
Accounts Payable Reports:
Accounts Payable reports are essentially a mirror of the A/R reports.

General Ledger Reports
As with A/R and A/P, GL reports accessed through the Print icon only provide data for the current period. To run GL reports for prior periods, use the Reports Tab.
For current period reports, although it appears that you can select a few accounts and print, for example, a trial balance, in reality you get the full report in all cases EXCEPT the Chart of Accounts. You can select specific accounts to print in this case, and choose Print Selected. Note that the Chart of Accounts is only available on the Print icon, and is not on the Reports Tab.
On the reports tab, for Financial Reports such as the Balance Sheet and Income Statement, you select the end date for which you would like the reports. All selected will print at once and will each show on a separate tab, which is very convenient.

Printing and Exporting GL Activity
One important report that many require is the GL Activity. This can only be run from the Transactions Tab, either the one for all accounts, or the one located within each account.
If you only require the GL transactions for one account, first go to that account and click on the Transactions tab.
Click Filters on, and choose ‘Transaction Date’ and then the period selector, which includes helpful settings such as the Current Month or Last Month.

Once you have the correct data, select the Print icon and Choose General Ledger Account Activity.
Note that you can also easily Export the transactions, which may be preferable depending on what you are doing. The data will appear in the same order as as on your screen.
_________________________________________________________________________
That sums up printing reports in Spire. Please contact me (rita.bloem@rogers.com) if you require further help, or if you require some forms or reports to be customized for your company.
